Primary tabs
Social Impact Database
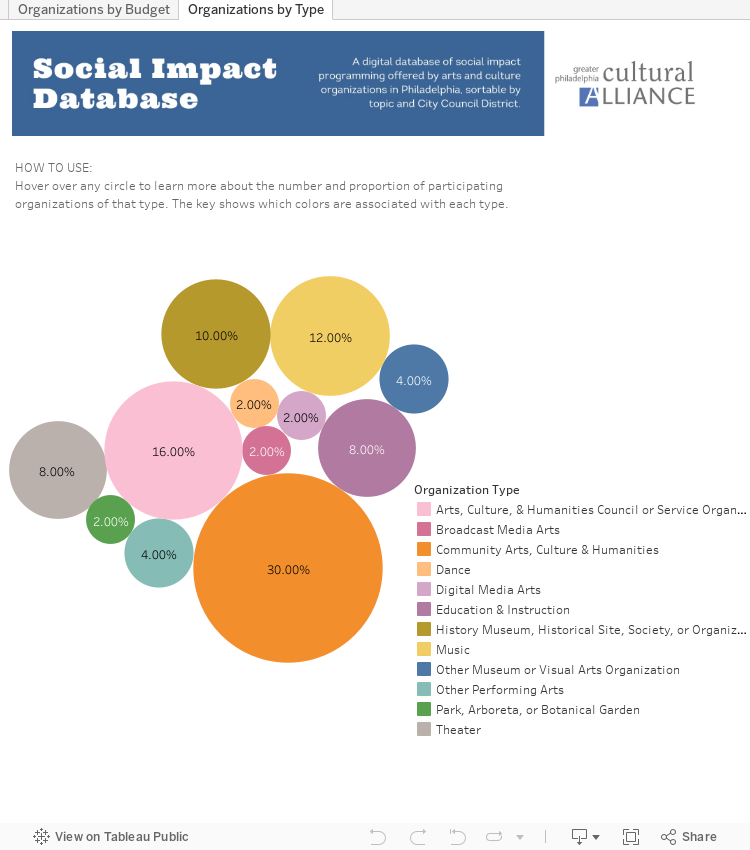
The Social Impact Database is a research project by the Greater Philadelphia Cultural Alliance, made possible by the support of AARP, which aims to highlight the significant social impact work that arts and cultural organizations in Philadelphia provide. This information is based on a survey of 50 Philadelphia-based arts and culture organizations and their self-reported 2024 programming. This project aims to serve as a tangible tool for government officials and as a resource for everyday Philadelphia citizens while raising awareness of the many arts organizations working in various areas throughout the city. For an in-depth review of the data, join us on Friday, January 10 at 10:00 a.m. for a virtual presentation. Register.
We’ve also produced dashboards where people can browse the program offerings, and others can embed the Database on their websites for easy access. This is sorted in three separate ways intended for different uses and audiences: by impact area (the aspect of civic life targeted by programming), by district (the ten City Council districts in Philadelphia), and by zip code (for a sense of program location). There are also two dashboards with more information about the organizations that participated.
Data Highlights
- 50 organizations responded to the survey.
- 69% of all programs in the survey had been running for five years or more.
- Programs run by participating organizations serve nearly 700,000 with in-person services.
- 61% of these programs from organizations in the survey offer 100% free programming.
- 63% of programs from organizations in the survey serve primarily low-income audiences.
Dashboards
Program Information
Select the desired programming categories from the "Impact Area" dropdown and hover over rows to see full descriptions. Copy/ paste any links to be redirected to the organization's website. You can also filter (and search in the filter bar) by the organization's budget, organization type, and the organization's name.
Descriptions and program categories have been edited for clarity and length. Organizations have been placed in districts using the lat and long designated in this report: https://data.lojic.org/datasets/HUD::zip-code-population-weighted-centro.... Report errors to KristenV@philaculture.org.

Organizational Information
Advisory Committee Members
- Dr. Neil P. Bardhan, Director of Applied Storytelling, First Person Arts
- Josie Bockelman, Deputy Director, The Clay Studio
- Samantha M Connors, Executive Director, Da Vinci Art Alliance
- Tony Derrico, Chief of Staff, Art-Reach
- Charlene Samuels, Constituent Services Representative, Office of Minority Leader Kendra Brooks
In addition, the Cultural Alliance would like to thank PA Humanities and Nicholas Crosson for their research partnership and support on this project. If you have any questions, contact Kristen Vinh at kristenv@philaculture.org